Field Report
This report consists of satellite results of one of your fields. Automated satellite Monitoring Service
allows
you to monitor multiple farming fields using latest satellite imagery.

Report Generation Date:
2022-10-31

Satellite imagery capture Date:
2022-10-31
Field Details

Field Address:
undefined

Field Area:
10000 square meters (approx.)

Field Location:
Latitude:
Longitude:
Table of Content
| SERIAL NO. |
TITLE |
PAGE NO. |
| 1 |
Understand the data for better farming
|
2 |
| 2 |
Weather Statistics for imagery capture
data |
3 |
| Weather Forecast for 7 days |
| Weather Graphs (for past 5 days) |
4 |
| 3 |
RGB Satellite Image |
4 |
| 4 |
Basic Analysis for Colorblind
Visualization |
4 |
| 5 |
Radar Images (RVI, Soil Moisture) |
5 |
| RVI (Radar Vegetation Index) |
| Soil Moisture |
| 6 |
Crop Health (NDVI, EVI, SAVI, NDRE) |
6 |
| NDVI (Normalized Difference Vegetation
Index) |
| EVI (Enhanced Vegetation Index) |
7 |
| SAVI (Soil Adjusted Vegetation Index)
|
8 |
| SAVI (Soil Adjusted Vegetation Index)
|
9 |
| 7 |
Irrigation (NDWI, NDMI,
Evapotranspiration) |
10 |
| NDWI (Normalized Difference Water Index)
|
| NDMI (Normalized Difference Moisture
Index) |
11 |
| Evapotranspiration |
12 |
| 8 |
Soil Health (SOC) |
12 |
| SERIAL NO. |
TITLE |
PAGE NO. |
| 1 |
Understand the data for better farming
|
2 |
| 2 |
Weather Statistics for imagery capture
data |
3 |
| Weather Forecast for 7 days |
| Weather Graphs (for past 5 days) |
4 |
| 5 |
Radar Images (RVI, Soil Moisture) |
5 |
| RVI (Radar Vegetation Index) |
| Soil Moisture |
page 1
Understand the
data for better
farming
For cloudy weather
use RVI
(Indicates cloudy in RGB/ETCI image)
If your vegetation is
at early growth stage
If your vegetation is
at later growth stage
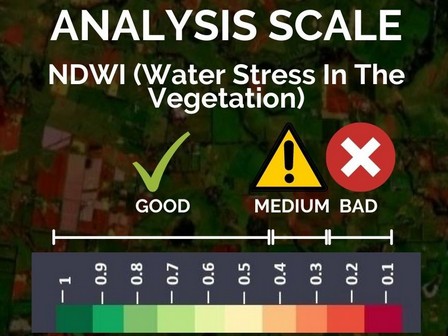
NDWI Image (For Irrigation)
Analysis Scale

Analysis Summary
For Cloudy Weather:
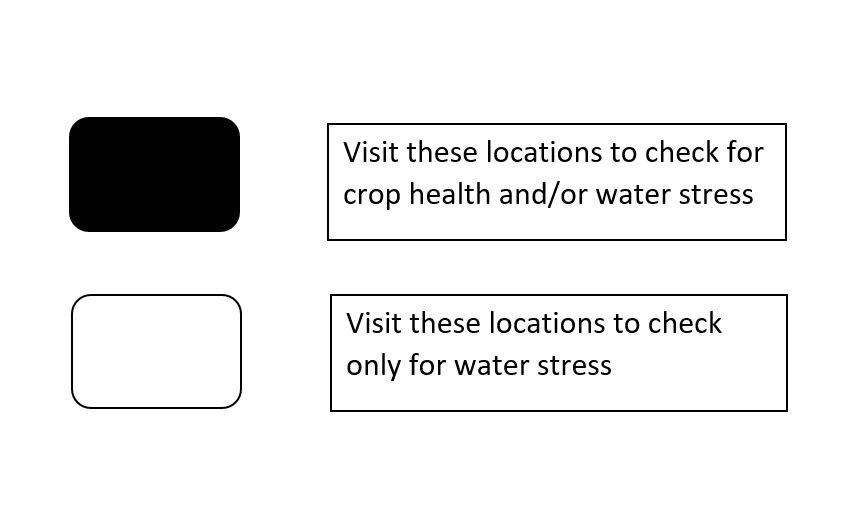
check these directions of your farm for irrigation problem - N, NW,
NE, W,
C, E,
SW, SE,
S
check these directions of your farm for crop health problem - N, NW,
NE,
W, C, E, SW, SE, S
for good weather and early stage plants:
check these directions of your farm for irrigation problem - N, NW, NE,
W,
C,
E,
SW, SE,
S
check these directions of your farm for crop health problem - N, NW,
NE, W,
C, E, SW, SE, S
for good weather and later stage plants:
check these directions of your farm for irrigation problem - N, NW, NE,
W,
C,
E,
SW, SE,
S
check these directions of your farm for crop health problem - N, NW,
NE, W,
C, E, SW, SE, S
page 2
Understand the data for better farming
For cloudy weather use RVI
(Indicates cloudy in RGB/ETCI image)
Analysis Scale


Analysis Summary
For Cloudy Weather:
check these directions of your farm for irrigation
problem - N, NW, NE, W,
C, E,
SW, SE,
S
check these directions of your farm for crop
health problem - N, NW, NE,
W, C, E, SW, SE, S
page 2
Weather Graphs (Using past 5 days data)
RGB Image
True color image is the unaltered raw satellite image retrieved for your area, whereas Enhanced true color
image is the processed satellite image of your area with enhanced land features. Using these two images you
can see any observable land changes around your field which may be crucial for your farming practices.
Basic Analysis for
Colourblind
Visualization (Crop Health + Irrigation)
page 4
Radar Images (RVI, Soil Moisture)
RVI (Normalized Difference Vegetation Index)
Scientific Background
NDVI measures status of plant health based on how plants reflect light at certain frequencies. Though we
cannot perceive it with our eyes, everything around us (including plants) reflects wavelengths of light in
visible and non-visible spectrum. Taking into account of certain wavelength is reflected, we can assess the
current status od plants. If a plant is healthy, it will have large amount of chlorophyll on its leaves and
will absorb good amount of visible light from 0.4 to 0.7 microns and reflect quite less of it and
vice-versa, we take into account this basic principle in identifying crop health status of agricultural
land.
Soil Moisture
Scientific Background
NDVI measures status of plant health based on how plants reflect light at certain frequencies. Though we
cannot perceive it with our eyes, everything around us (including plants) reflects wavelengths of light in
visible and non-visible spectrum. Taking into account of certain wavelength is reflected, we can assess the
current status od plants. If a plant is healthy, it will have large amount of chlorophyll on its leaves and
will absorb good amount of visible light from 0.4 to 0.7 microns and reflect quite less of it and
vice-versa, we take into account this basic principle in identifying crop health status of agricultural
land.
page 5
Crop Health (NDVI, EVI, SAVI, NDRE)
NDVI (Normalized Difference Vegetation Index)
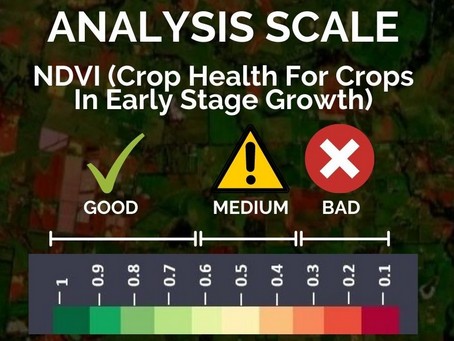
NDVI image provides you a colour map of the vegetation of your farming field and nearby areas. The areas
shown in red are the regions where the crop growth may not be normal. You should refer to these images when
your crop is in early stage of growth.
Scientific Background
NDVI measures status of plant health based on how plants reflect light at certain frequencies. Though we
cannot perceive it with our eyes, everything around us (including plants) reflects wavelengths of light in
visible and non-visible spectrum. Taking into account of certain wavelength is reflected, we can assess the
current status od plants. If a plant is healthy, it will have large amount of chlorophyll on its leaves and
will absorb good amount of visible light from 0.4 to 0.7 microns and reflect quite less of it and
vice-versa, we take into account this basic principle in identifying crop health status of agricultural
land.
page 6
NDVI (Normalized Difference Vegetation Index)
NDVI image provides you a colour map of the vegetation of your farming field and nearby areas. The areas
shown in red are the regions where the crop growth may not be normal. You should refer to these images when
your crop is in early stage of growth.
Scientific Background
NDVI measures status of plant health based on how plants reflect light at certain frequencies. Though we
cannot perceive it with our eyes, everything around us (including plants) reflects wavelengths of light in
visible and non-visible spectrum. Taking into account of certain wavelength is reflected, we can assess the
current status od plants. If a plant is healthy, it will have large amount of chlorophyll on its leaves and
will absorb good amount of visible light from 0.4 to 0.7 microns and reflect quite less of it and
vice-versa, we take into account this basic principle in identifying crop health status of agricultural
land.
page 7
NDVI (Normalized Difference Vegetation Index)
NDVI image provides you a colour map of the vegetation of your farming field and nearby areas. The areas
shown in red are the regions where the crop growth may not be normal. You should refer to these images when
your crop is in early stage of growth.
Scientific Background
NDVI measures status of plant health based on how plants reflect light at certain frequencies. Though we
cannot perceive it with our eyes, everything around us (including plants) reflects wavelengths of light in
visible and non-visible spectrum. Taking into account of certain wavelength is reflected, we can assess the
current status od plants. If a plant is healthy, it will have large amount of chlorophyll on its leaves and
will absorb good amount of visible light from 0.4 to 0.7 microns and reflect quite less of it and
vice-versa, we take into account this basic principle in identifying crop health status of agricultural
land.
page 8
NDVI (Normalized Difference Vegetation Index)
NDVI image provides you a colour map of the vegetation of your farming field and nearby areas. The areas
shown in red are the regions where the crop growth may not be normal. You should refer to these images when
your crop is in early stage of growth.
Scientific Background
NDVI measures status of plant health based on how plants reflect light at certain frequencies. Though we
cannot perceive it with our eyes, everything around us (including plants) reflects wavelengths of light in
visible and non-visible spectrum. Taking into account of certain wavelength is reflected, we can assess the
current status od plants. If a plant is healthy, it will have large amount of chlorophyll on its leaves and
will absorb good amount of visible light from 0.4 to 0.7 microns and reflect quite less of it and
vice-versa, we take into account this basic principle in identifying crop health status of agricultural
land.
page 9
Crop Health (NDVI, EVI, SAVI, NDRE)
ndwi (Normalized Difference Vegetation Index)
ndwi image provides you a colour map of the vegetation of your farming field and nearby areas. The areas
shown in red are the regions where the crop growth may not be normal. You should refer to these images when
your crop is in early stage of growth.
Scientific Background
ndwi measures status of plant health based on how plants reflect light at certain frequencies. Though we
cannot perceive it with our eyes, everything around us (including plants) reflects wavelengths of light in
visible and non-visible spectrum. Taking into account of certain wavelength is reflected, we can assess the
current status od plants. If a plant is healthy, it will have large amount of chlorophyll on its leaves and
will absorb good amount of visible light from 0.4 to 0.7 microns and reflect quite less of it and
vice-versa, we take into account this basic principle in identifying crop health status of agricultural
land.
page 10
NDVI (Normalized Difference Vegetation Index)
NDVI image provides you a colour map of the vegetation of your farming field and nearby areas. The areas
shown in red are the regions where the crop growth may not be normal. You should refer to these images when
your crop is in early stage of growth.
Scientific Background
NDVI measures status of plant health based on how plants reflect light at certain frequencies. Though we
cannot perceive it with our eyes, everything around us (including plants) reflects wavelengths of light in
visible and non-visible spectrum. Taking into account of certain wavelength is reflected, we can assess the
current status od plants. If a plant is healthy, it will have large amount of chlorophyll on its leaves and
will absorb good amount of visible light from 0.4 to 0.7 microns and reflect quite less of it and
vice-versa, we take into account this basic principle in identifying crop health status of agricultural
land.
page 11
Evapotranspiration

Identifies Location where water is getting into the
Atmosphere at a High rate
Satellite remote sensing of evapotranspiration is an essential part of the global observation system
and provide inputs for agriculture, water resources management, weather forecasts, climate studies
and many other applications.
Soil Health (soil, EVI, SAVI,
NDRE)
soil (Normalized Difference Vegetation Index)
soil image provides you a colour map of the vegetation of your farming field and nearby areas. The areas
shown in red are the regions where the crop growth may not be normal. You should refer to these images
when
your crop is in early stage of growth.
page 12


