Field Report
This report consists of satellite results of one of your fields. Automated satellite Monitoring Service allows you to monitor multiple farming fields using latest satellite imagery.

Report Generation Date:
2024-09-02

Satellite imagery capture Date:
2024-9-1
Field Details

Field Address:
fy-2023/24,Harishchandra Hans

Field Area:
4485 sq m (approx.)

Field Location:
Latitude:20.539
Longitude:82.929
Table of Content
| SERIAL NO. |
TITLE |
PAGE NO. |
| 1 |
Understand the data for better farming |
2 |
| 2 |
Weather Statistics for imagery capture data |
3 |
| Weather Forecast for 7 days |
| Weather Graphs (for past 5 days) |
4 |
| 3 |
Radar (RVI, RSM) |
5 |
| RVI (Radar Vegetation Index) |
| RSM (Radar Soil Moisture) |
| 4 |
Crop Health (NDVI, EVI, SAVI, NDRE) |
6 |
| NDVI (Normalized Difference Vegetation Index) |
| EVI (Enhanced Vegetation Index) |
7 |
| SAVI (Soil Adjusted Vegetation Index) |
8 |
| NDRE (Normalized Difference Red Edge) |
9 |
| 5 |
Irrigation (NDWI, NDMI, Evapotranspiration) |
10 |
| NDWI (Normalized Difference Water Index) |
| NDMI (Normalized Difference Moisture Index) |
11 |
| Evapotranspiration |
12 |
| 6 |
Soil Health (SOC) |
12 |
| 7 |
RGB Satellite Image |
13 |
| 8 |
Basic Analysis for Colorblind Visualization |
13 |
| SERIAL NO. |
TITLE |
PAGE NO. |
| 1 |
Understand the data for better farming |
2 |
| 2 |
Weather Statistics for imagery capture data |
3 |
| Weather Forecast for 7 days |
| Weather Graphs (for past 5 days) |
4 |
| 5 |
Radar (RVI, RSM) |
5 |
| RVI (Radar Vegetation Index) |
| RSM (Radar Soil Moisture) |
| SERIAL NO. |
TITLE |
PAGE NO. |
| 1 |
Oil Palm shows good result in RECI and NDRE |
2 |
| 1 |
Understand the data for better farming |
2 |
| 2 |
Weather Statistics for imagery capture data |
3 |
| Weather Forecast for 7 days |
page 1
Oil Palm shows good result in RECI and NDRE
Field Google Map
![]()

RECI (Red Edge Chlorophyll Index)

RECI is used for disease / pest detection.
NDRE (Normalized Difference Red Edge Image)

NDRE is used for crop health at high canopy density areas.
page 2
Understand the data for better farming

Crop inspection is required in center direction of your field
Probable causes for bad crop health:
- Pest/Disease Attack
- Improper Farm Input Application
- Insufficient irrigation
- Sudden weather changes

NDWI Image (For Irrigation)

Irrigation inspection is required in center, east, south directions of your field
Probable causes for bad irrigation:
- Low Water Quantity in Plants
- Low Soil Moisture
- High Evapotranspiration Rate


DEM image tells probable flooding areas due to being at lower terrain.
Your farm is uniformly level/flat
SOC (For Soil Carbon Analysis)

SOC image provides a map of soil organic matter, present at the field.
Soil organic carbon is looking good in your field
page 2
Understand the data for better farming
For cloudy weather use RVI
(Indicates cloudy in RGB/ETCI image)
Analysis Scale


Analysis Summary
For Cloudy Weather
Irrigation is in good condition
Crop is in good condition
page 2
Understand the data for better farming
Field Google Map
![]()

NDVI (For Crop Health)
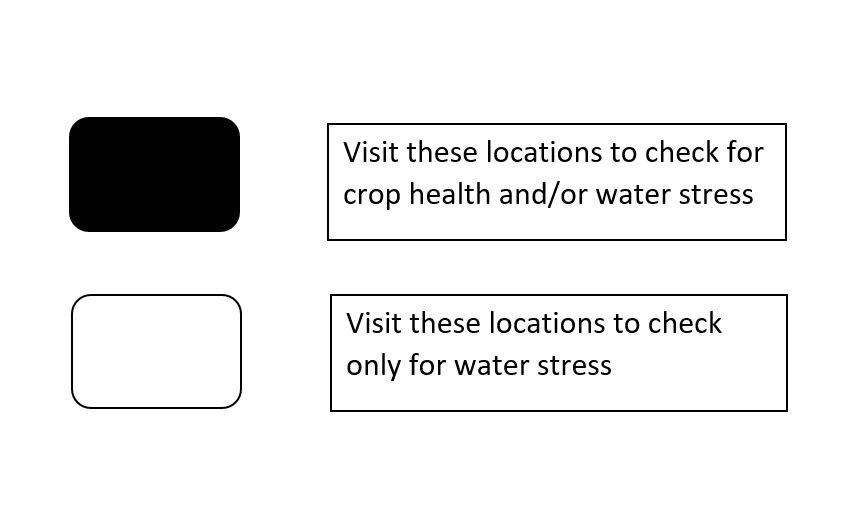
Crop inspection is required in center direction of your field
NDWI Image (For Irrigation)

Irrigation inspection is required in center, east, south directions of your field
page 2
Weather Graphs (Using past 5 days data)
page 4
Radar (RVI, RSM)
RVI (Radar Vegetation Index)
Scientific Background
Radar Vegetation Index generally ranges between 0 and 1 and is a measure of the randomness of the scattering. RVI is near zero for a smooth bare surface and increases as a crop grows (up to a point in the growth cycle). Use this index for crop health estimation during cloudy weather.
RSM (Radar Soil Moisture)
Scientific Background
soil moisture measures status of plant health based on how plants reflect light at certain frequencies. Though we cannot perceive it with our eyes, everything around us (including plants) reflects wavelengths of light in visible and non-visible spectrum. Taking into account of certain wavelength is reflected, we can assess the current status od plants. If a plant is healthy, it will have large amount of chlorophyll on its leaves and will absorb good amount of visible light from 0.4 to 0.7 microns and reflect quite less of it and vice-versa, we take into account this basic principle in identifying crop health status of agricultural land.
page 5
Crop Health (NDVI, EVI, SAVI, NDRE)
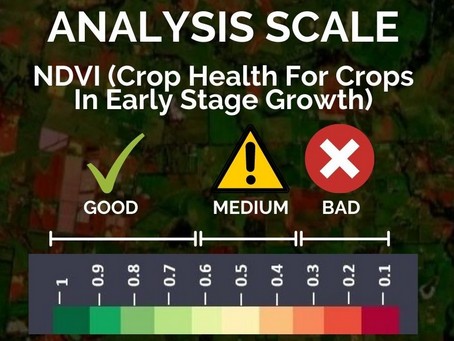
NDVI (Normalized Difference Vegetation Index)
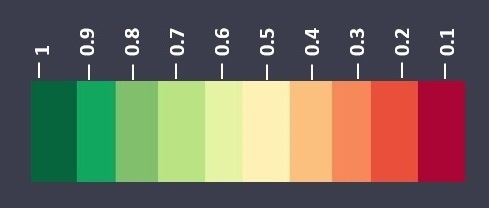
NDVI image provides you a colour map of the vegetation of your farming field and nearby areas. The areas shown in red are the regions where the crop growth may not be normal. You should refer to these images when your crop is in early stage of growth.
Use When vegetation is of good height


Use When vegetation is of small height


Scientific Background
NDVI measures status of plant health based on how plants reflect light at certain frequencies. Though we cannot perceive it with our eyes, everything around us (including plants) reflects wavelengths of light in visible and non-visible spectrum. Taking into account of certain wavelength is reflected, we can assess the current status od plants. If a plant is healthy, it will have large amount of chlorophyll on its leaves and will absorb good amount of visible light from 0.4 to 0.7 microns and reflect quite less of it and vice-versa, we take into account this basic principle in identifying crop health status of agricultural land.
page 6
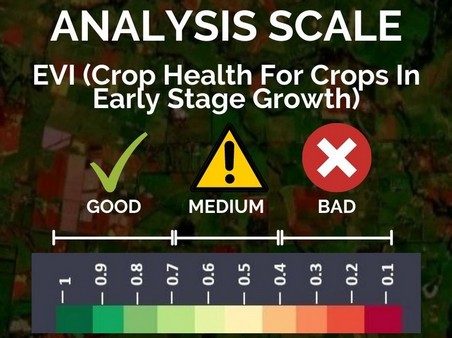
EVI (Enhanced Vegetation Index)
EVI image provides you a colour map of the vegetation of your farming field and nearby areas. The areas shown in red are the regions where the crop growth may not be normal. You should refer to these images when your crop is in later stage of growth and your crop canopy is dense.
Use When vegetation is of good height


Use When vegetation is of small height


Scientific Background
The Enhanced Vegetation Index (EVI) uses additional wavelengths of light to correct for the inaccuracies of NDVI. Variations in solar incidence angle, atmospheric conditions like distortions in the reflected light cased by the particles in the air, and signals from the ground cover below the vegetation are corrected for using EVI.
page 7
SAVI (Soil Adjusted Vegetation Index)
SAVI image provides you a colour map of the vegetation of your farming field and nearby areas. The areas shown in red are the regions where the crop growth may not be normal. You should refer to these images when your crop is in the later stage of growth and your crop canopy is dense.
Use When vegetation is of good height


Use When vegetation is of small height


Scientific Background
The soil-adjusted vegetation index was developed as a modification of the Normalized Difference Vegetation Index to correct for the influence of soil brightness when vegetative cover is low. The SAVI is structured similar to the NDVI but with the addition of a “soil brightness correction factor”.
page 8
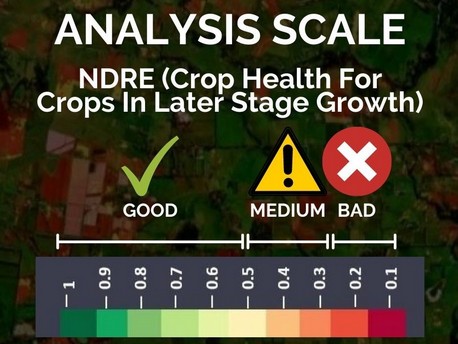
NDRE (Normalized Difference Red Edge Image)
NDRE image provides you a colour map of the vegetation of your farming field and nearby areas. The areas shown in red are the regions where the crop growth may not be normal. You should refer to these images when your crop is in the later stage of growth.
Use When vegetation is of good height


Use When vegetation is of small height


Scientific Background
NDRE uses combination of near infrared light and a frequency band that is in the transition region between visual red and NIR light. The red edge band of NDRE provides a measurement that is not strongly absorbed by just the topmost layers of leaves. By using NDRE, one can get better insight into crops in their later stage because it is able to observe further down into the canopy a well. NDRE is also less prone to saturation in the presence of dense vegetation. This will help us get much accurate results in pasture biomass estimation measurements. Thus, in situation like these, NDRE can provide a much accurate and better measurement of variability in an area in which the NDVI measurement would come simply as 1.0.
page 9
Irrigation (NDWI, NDMI, Evapotranspiration)
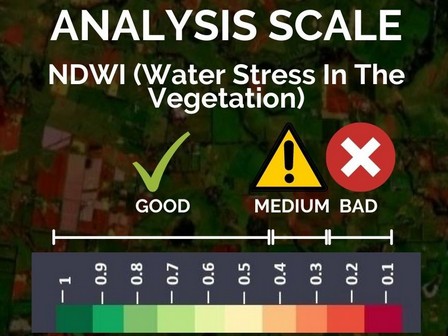
NDWI (Normalized Difference Water Index)
NDWI image provides you a colour map of the vegetation of your farming field and nearby areas. It provides information about the presence of water in the plants. The areas shown in red are the regions where the water level may not be normal. In case of drought or less rainfall, these areas will be the most affected.
Use When vegetation is of good height


Use When vegetation is of small height


Scientific Background
Vegetation cover on the earth surface undergoes severe stress in plants during a drought. If affected areas are not identified in time, entire crops may be damaged. Hence, the early detection of water quantity in plants can prevent many of the negative impacts on crops. NDWI can help us control irrigation and significantly improve agriculture, especially in areas where meeting the need for water is difficult.
page 10
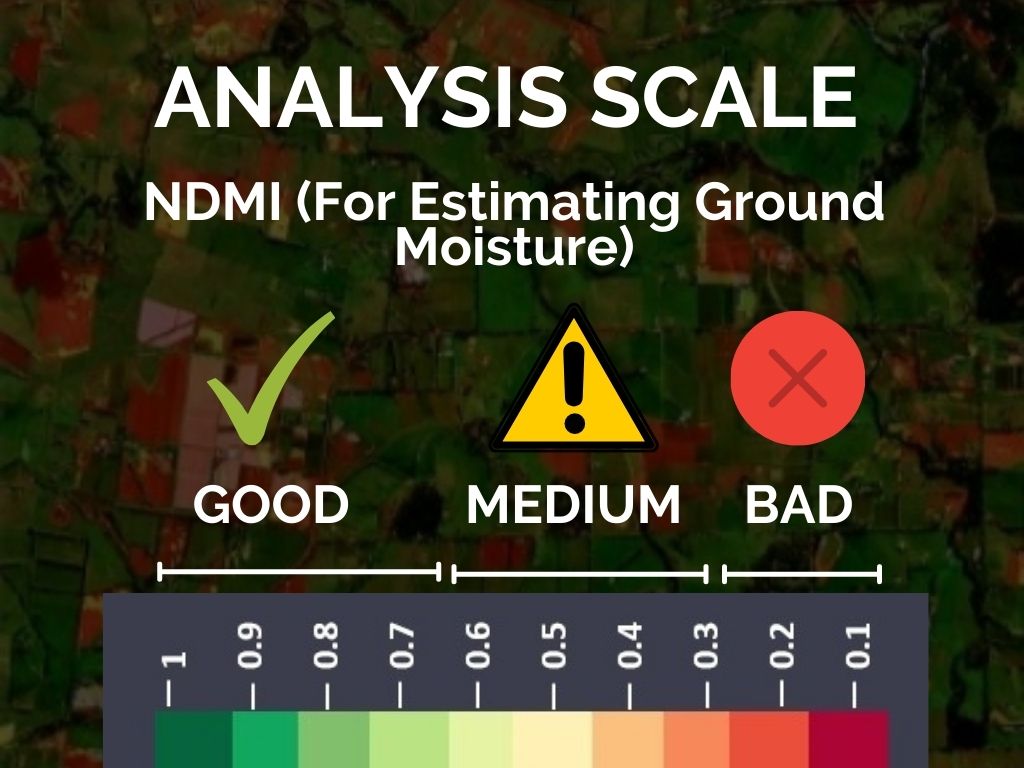
NDMI (Normalized Difference Moisture Index)
Vegetation cover on the earth surface undergoes severe stress in plants during a drought. It provides information about presence of moisture in the soil. If affected areas are not identified in time, entire crops may be damaged. Hence, the early detection of water quantity in plants can prevent many of the negative impacts on crops. NDMI can help us control irrigation and significantly improve agriculture, especially in areas where meeting the need for water is difficult.
Use When vegetation is of good height


Use When vegetation is of small height


Scientific Background
The NDMI is a normalized difference moisture index, that uses NIR and SWIR bands to display moisture. The SWIR band reflects changes in both the vegetation water content and the spongy mesophyll structure in vegetation canopies, while the NIR reflectance is affected by leaf internal structure and leaf dry matter content but not by water content. The combination of the NIR with the SWIR removes variations induced by leaf internal structure and leaf dry matter content, improving the accuracy in retrieving the vegetation water content.
page 11
Evapotranspiration

Identifies Location where water is getting into the Atmosphere at a High rate
Evapotranspiration is the loss of water from the soil surface as well as from the plants. It measures the rate at which evaporation and transpiration occurs at multiple locations on the farm. Through evapotranspiration one can easily schedule the irrigation based on the indicators received by the data. Nevertheless, it can be ignored if NDWI and NDMI data result in a good condition.
Soil Health (SOC)
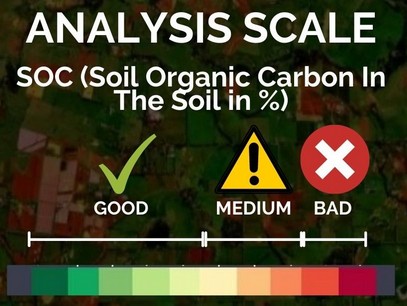
SOC image provides you a colour map of percentage of organic matter present at your selected field. Organic matter contributes to nutrient retention and turnover, soil structure, moisture retention and availability degradation of pollutants, carbon sequestration and soil resilience. The areas shown in red are the regions where the soil organic carbon is less than 1%.
Use When vegetation is of good height


Use When vegetation is of small height


page 12
RGB Image
True color image is the unaltered raw satellite image retrieved for your area, whereas Enhanced true color image is the processed satellite image of your area with enhanced land features. Using these two images you can see any observable land changes around your field which may be crucial for your farming practices.
Basic Analysis for Colourblind Visualization (Crop Health + Irrigation)
page 13


